

Today the U.S. Census Bureau began to release the 2020 Census statistics — the start of at least a few weeks of data flowing from the U.S. Department of Commerce, where the U.S. Census Bureau resides. If anything, the news is mixed. On a macro scale, the population continues to shift toward metropolitan areas, the growth is concentrating in the west and south, and the U.S. growth rate was the slowest it has been since the 1930s.
From 2010 to 2020, the population of the United States grew by 7.4 percent (Some 22.2 million people), going from 308,745,538 to 331,449,281.
But population growth over the past decade nowhere near matches the country’s 18.5 percent growth during the 1950s, or even the 13.2 percent growth rate from 1990 to 2000. In fact, you have to go back to the decade of the Great Depression — 1930 to 1940 when the growth rate was 7.3 percent — to find a comparatively slow rate of growth.
During the decade from 2010 to 2020, Colorado’s population grew by half a million people; rising from 5,029,196 to 5,773,714. The 14.8 percent increase probably comes as no surprise to Colorado residents who have experienced (some would say endured) the growth.
In 2010, 85 percent of the U.S. population lived in metro areas — by 2020 it was 86 percent. Another 8 percent lived in what is referred to as “micropolitan statistical areas”, down from 9 percent in 2010.
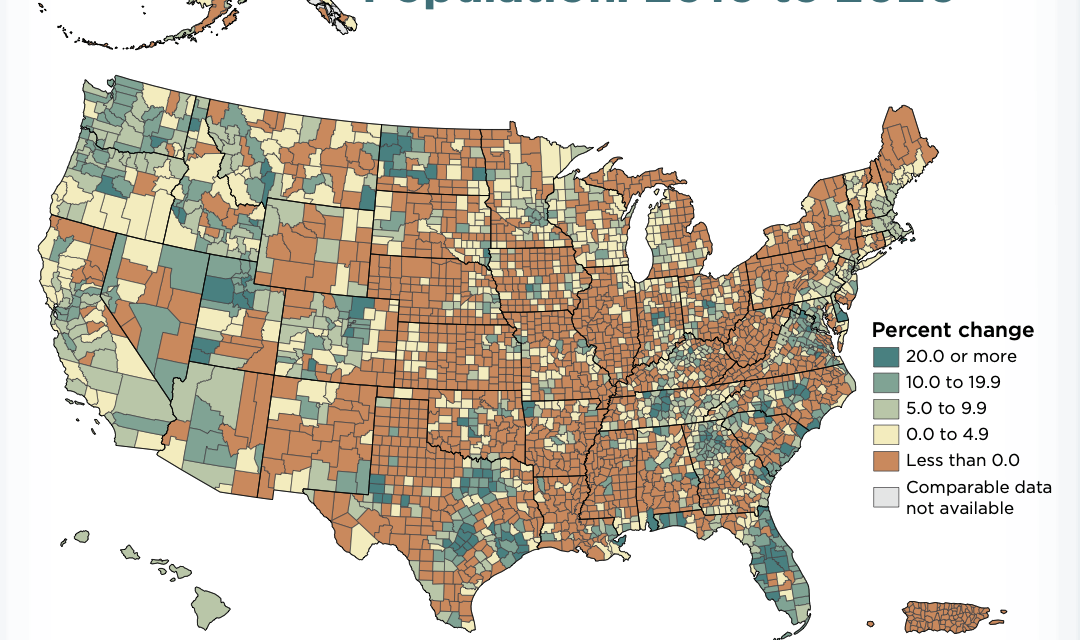
County Population Changes
More than half of the 3,143 counties (or county-equivalents) in the United States were smaller in 2020 than in 2010, losing population, while the populations of around four-fifths of metro areas grew during the time period.
But almost half (47 percent) of U.S. counties or equivalents gained population between 2010 and 2020. Chaffee county is on the growth side of that statistic. While the exact number won’t be released until next week, the Census map shows that the county has grown between 5.0 and 9.9 percent in the decade from 2010 to 2020. Again — this comes as no surprise to county residents.
Five counties (metro areas in parentheses) gained at least 300,000 people during that period: Harris County, Texas (Houston-The Woodlands-Sugar Land); Maricopa County, Arizona (Phoenix-Mesa-Chandler); King County, Washington (Seattle-Tacoma-Bellevue); Clark County, Nevada (Las Vegas-Henderson-Paradise); and Tarrant County, Texas (Dallas-Fort Worth-Arlington).
California’s Los Angeles County remained the largest county in 2020, crossing the 10.0 million-person mark between 2010 and 2020.
State growth concentrated in the West and South
Five states accounted for nearly half of the total numeric population increase in the United States between 2010 and 2020: Texas, Florida, California, Georgia, and Washington.
Utah was the fastest-growing state, increasing by 18.4 percent between 2010 and 2020, followed by Idaho, Texas, North Dakota, and Nevada, which each grew by 15.0 percent or more. 13 states and the District of Columbia grew by 10.0 percent or greater (including Colorado at 14.8 percent). All are in the West or South regions, with the exception of North Dakota in the Midwest region:
- Utah
- Idaho
- Texas
- North Dakota
- Nevada
- Colorado
- Oregon
- Washington
- Arizona
- Florida
- Georgia
- South Carolina
- District of Columbia


Recent Comments